MATLAB Plotyy Python Code Example

John on July 15, 2021

Here are two examples of using the matplotlib.pyplot module:
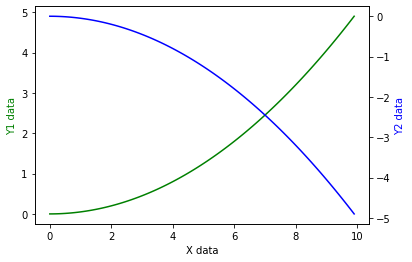
Adding a y-axis label to secondary y-axis in matplotlib:
import numpy as np
import matplotlib.pyplot as plt

x = np.arange(0, 10, 0.1)
y1 = 0.05 * x**2
y2 = -1 *y1

fig, ax1 = plt.subplots()

ax2 = ax1.twinx()
ax1.plot(x, y1, 'g-')
ax2.plot(x, y2, 'b-')

ax1.set_xlabel('X data')
ax1.set_ylabel('Y1 data', color='g')
ax2.set_ylabel('Y2 data', color='b')

plt.show()
Twin axis example:
import numpy as np
import matplotlib.pyplot as plt

ax1=plt.subplot(111)
ax1.plot(np.arange(0,10),np.arange(0,10))
ax2=ax1.twinx()
ax2.plot(np.arange(10,20),np.arange(100,110))

matlab